
 New resources available
for your clinical practice.
Click here


Over the years, various mechanisms have been proposed to describe the pathogenic events leading to the development of Alzheimer's disease (AD), all of which suggest that neuronal dysfunction and synaptic failure are common features of AD and play a pivotal role in cognitive dysfunction.2,3
The pathophysiological hallmarks of AD consist of amyloid beta (Aβ) plaques, which is a toxic form of amyloid beta protein, and neurofibrillary tangles (NFT) in cortical neurons, mainly constituted by an abnormally hyperphosphorylated form of tau protein (p-tau).4-6
Together, amyloid beta plaques and tangles of tau proteins in the brain are the two core defining processes leading to neurodegeneration through neuronal and synaptic loss leading to brain atrophy.4-6,13
Learn More About the Mechanism of Alzheimer’s Disease
Learn More About
the Mechanism of
Alzheimer’s Disease
Read video transcript
The Mysteries and Paths of Alzheimer’s Disease
Subjective memory complaints and a decline of performance of daily activities may indicate early stages of Alzheimer’s disease or “AD”, particularly in patients aged 65 or older.
AD is a progressive disease, beginning with pathological changes that occur decades before clinical symptoms, leading eventually to the development of mild cognitive impairment, functional symptoms, and then dementia.
AD accounts for as many as 80% of all dementia diagnoses.
Today, we are able to diagnose AD in its early symptomatic stages by assessing biomarkers, and by using tests to evaluate cognitive performance, functional impairment, and behavioural symptoms.
To better understand the disease, we must look back in time to the pathological origins of AD within the brain. The two pathological hallmarks of AD appear at distinct locations within the brain: plaques, made up of Aβ, occur outside of neurons, while neurofibrillary tangles, composed of tau protein, develop within neurons. Abnormal accumulation of Aβ within the brain may begin decades before symptoms appear. Aβ is produced when amyloid precursor protein or “APP” is cleaved by β-secretase (BACE1) and then by ɤ-secretase. Aβ is formed in the course of normal brain metabolism, however, it may be overproduced in certain individuals.
In healthy people, Aβ is cleared from the brain through systemic circulation and local processes — such as uptake by microglia. Both the overproduction of Aβ and inadequate clearance mechanisms can cause Aβ peptides to accumulate in the brain and self-aggregate into plaques. Plaque deposition is first seen in the brain’s neocortex the center of higher mental functions. It progresses to the more primitive cortex, including the hippocampus and related structures involved in learning and memory. Finally, it spreads to subcortical areas that regulate attention, emotion, and various other activities. Positron-emission tomography or “PET” can detect evidence of Aβ deposition and plaques. Low levels of Aβ in cerebrospinal fluid or “CSF” can also indicate pathology. Over time, the accumulation of amyloid plaques activates cells of the neuronal immune system, potentially causing a chronic inflammatory reaction that has toxic effects on neurons. Aβ may also disrupt the energy supply of neurons, and induce oxidative stress, causing further cellular injury.
Tau protein pathology begins to appear approximately 15 years before the onset of clinical AD symptoms. Tau is normally associated with microtubules, which maintain structural and transport systems within neurons. In people with AD, the presence of Aβ may promote the abnormal phosphorylation of tau, followed by its detachment of microtubules. Tau subsequently associates into insoluble structures called paired helical filaments, which further aggregate to form neurofibrillary tangles.
Higher, abnormal levels of tau can be detected in the cerebrospinal fluid. While neurofibrillary tangles may appear in the brains of people with other neurodegenerative diseases, there is growing evidence that the toxic effects of tau and Aβ may amplify each other in people with AD. Eventually, the underlying pathology of AD causes synaptic dysfunction and neuronal loss.
This results in cortical thinning or atrophy, leading to more advanced symptoms. As the disease progresses, it extends to different parts of the brain, with corresponding biomarker evidence of pathology. As more regions are affected, more symptoms appear. Over time, pathology spreads to regions of the brain that control basic functions such as heart rate, leading ultimately to death.
AD is often diagnosed in the mild AD dementia stage, and average survival is 4 to 8 years after the diagnosis of AD but can be longer depending on other factors. With ongoing advances in AD research, we continue to enhance our understanding of underlying disease processes and the sequence in which they occur. We now know that AD begins with clinically silent processes, which lead to the appearance of symptoms decades later. Diagnosis of the earliest stages of AD is being aided by emerging risk factor evidence, improved screening tools that evaluate symptoms with greater accuracy, and novel techniques for the detection and measurement of AD biomarkers. It is hoped that ongoing and future research continues to help unravel the causes of AD and hopefully aids in better treatment of this complex disease.
Aβ plaque deposition and NFT formation begins approximately 15-20 years before the onset of clinical AD symptoms.1
Aβ protein is formed in the course of normal brain metabolism and is produced when amyloid precursor protein or “APP” is cleaved by β-secretase (BACE1) and then by ɤ-secretase. In healthy people, Aβ is cleared from the brain through systemic circulation and local processes - such as uptake by microglia.1
Aβ protein is overproduced in certain individuals and aggregates outside of neurons into soluble oligomers, which then combine to form insoluble fibrils and plaques. Initially plaques deposit in the brain’s neocortex, the center of higher mental functions. This progresses to the more primitive cortex, including the hippocampus and related structures involved in learning and memory. Finally, it spreads to subcortical areas that regulate attention, emotion, and various other activities impacting independent living.1,5
Multiple Forms of Amyloid Beta Protein Result in Abnormal Accumulation and Aggregation in the Brain
Soluble
Insoluble
Aggregated


Monomer


Oligomer


Fibril


Amyloid plaque
Amyloid beta monomers (single peptides) aggregate into soluble oligomers (small aggregates of peptides), which then combine to form insoluble fibrils (long aggregates of peptides) and plaques. It is unclear whether all or only some of these amyloid beta forms are damaging to the brain, but there is evidence to support that aggregated forms, such as oligomers and plaques, may be toxic to nerve cells.4
Over time, the accumulation of amyloid plaques activates cells of the neuronal immune system, potentially causing a chronic inflammatory reaction that has toxic effects on neurons. The energy supply of neurons is disrupted, and oxidative stress is induced further causing cellular injury.7
Normal Cognitive Ageing
In cognitively normal individuals, amyloid beta (Aβ) is cleared from the brain via blood-brain barrier or via peripheral removal.8
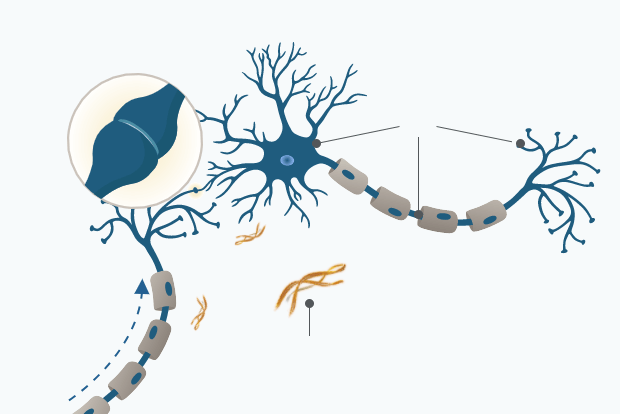
Intact synapse
tau
Neural signal
Amyloid beta aggregates
associated with normal ageing
AD Pathology
Alzheimer’s disease is associated with the accumulation of insoluble forms of Aβ in plaques in extracellular spaces, and aggregation of the microtubule protein tau in neurofibrillary tangles (NFT) in neurons long before the first symptoms of AD become visible.1
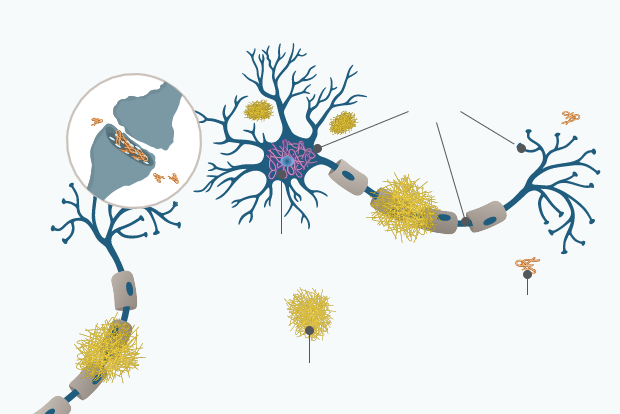
Synaptic loss
p-tau
Neurofibrillary tangles
Aβ Oligomer
Amyloid plaques
Tau protein pathophysiology begins approximately 15 years before the onset of clinical AD symptoms:9
Tau is normally associated with microtubules, which are elements of the cytoskeleton and maintain structural and transport systems within neurons. In people with AD, the presence of Aβ may promote the abnormal phosphorylation of tau. Phosphorylated tau proteins detach from microtubules and associate into insoluble structures and then aggregate to form neurofibrillary tangles (NFT) within the neuron. NFT formation starts in the allocortex of the medial temporal lobe (entorhinal cortex and hippocampus) and spreads to the associative isocortex.10
Higher, abnormal levels of phosphorylated tau can be detected in the cerebrospinal fluid (CSF).9 Many studies have shown that total tau (t-tau: all tau isoforms irrespective of phosphorylation state) and phosphorylated tau (p-tau: tau with phosphorylation at residues 181 or 231) levels are increased in both the brains and the CSF of patients with Alzheimer’s disease.1,11
There is growing evidence that the toxic effects of phospho-tau protein aggregation and Aβ protein accumulation may amplify each other in people with AD. This leads to a cascade characterized by synaptic dysfunction and neuronal cell death, which results in cortical thinning or brain atrophy.5,12,13
Biomarkers to Support Earlier AD Detection
Today several methods are validated to quantify AD biomarkers early in the disease, including various imaging methods via positron emission tomography (PET) or quantification via immunoassay analysis of cerebrospinal fluid (CSF).1
Based on the current literature there are 5 well established biomarkers of AD that help detect the underlying AD pathophysiology: Decreased CSF Aβ42 concentration, increased signal on amyloid PET imaging of the brain, increased CSF t-tau and p-tau concentrations, decreased fluorodeoxyglucose uptake on brain PET (FDG PET), structural MRI measures of cerebral atrophy, and measure of cognitive impairment through specific questionnaires and tests.11
These major AD biomarkers become abnormal in a temporally ordered manner along the Alzheimer’s disease continuum.2,3
Click on the circular symbols to learn more about each major AD Biomarker
- Aβ
- Tau-Mediated Neuronal Injury and Dysfunction
- Brain Structure
- Cognitive Function
- Clinical Function


Abnormal
BIOMARKER MAGNITUDE
Normal
Cognitively Normal
MCI
Dementia


Abnormal
BIOMARKER MAGNITUDE
Normal
Cognitively Normal
MCI
Dementia
Click on the circular symbols to learn more about each major AD Biomarker
Adapted from Jack et al. (2010)11
Adapted from Jack et al. (2010)11
Amyloid Beta (Aβ)
Category: Measure of brain Aβ deposition
CSF Levels of Aβ42 or Aβ42/ Aβ40 Ratio
It is believed that amyloid beta accumulation starts decades before the onset of clinical symptoms, setting off a cascade that leads to the formation of neurofibrillary tangles and the initiation of neurodegeneration in Alzheimer’s disease.3,5,13
Reduced levels of soluble forms of Aβ42 in CSF are detected due to deposition of Aβ42 in brain parenchyma and reduced clearance from the brain. Although various isoforms of Aβ can be identified in patients with AD, the CSF levels of Aβ42 and the CSF Aβ42/ Aβ40 ratio represent potential opportunities to provide the most reliable disease indicator. Aβ40 is the most abundant Aβ isoform and by adding it into the Aβ42/ Aβ40 ratio, interpatient variability can be diminished.2,14-17
Measure consistent with AD: Reduced CSF Aβ42 concentration and/or reduced Aβ42/ Aβ40 ratio
Aβ PET Imaging
Aβ PET imaging provides information about the extent of Aβ plaque burden in brain. The radioactive PET imaging tracer Pittsburgh compound B (PiB) binds to fibrillar Aβ with high affinity.18
Low CSF Aβ42, low CSF Aβ42/ Aβ40 ratio, and positive amyloid PET correlate and show strong correspondence in the majority of cases, making both methods reasonable for clinical diagnostics.1,16
Measure consistent with AD: Increased signal
CSF biomarker assays and PET imaging concordance16,17
-
CSF Aβ42 levels and CSF Aβ42/Aβ40 ratio correlate with amyloid PET results
-
CSF p-tau/Aβ42 ratio and CSF t-tau/Aβ42 ratio correlate with amyloid PET results
Tau-Mediated Neuronal Injury and Dysfunction
Category: Measure of neurodegeneration: synaptic dysfunction
CSF Tau
The accumulation of amyloid beta is believed to promote the abnormal phosphorylation of tau protein, which leads to the formation of neurofibrillary tangles within neurons and thereby causing neuronal injury accompanied by synaptic dysfunction.1,13
- p-tau is a marker for the neurofibrillary tangle pathology (hyperphosphorylation) in the brain. It is specific for AD and is not elevated in primary tauopathies, head injury, or stroke. Abnormal CSF levels of p-tau have been shown to correlate with fast clinical progression.1,2,19
- t-tau reflects the intensity of neuronal and axonal degeneration in general. Increased levels are found in AD but also in neurodegenerative disorders without tau pathology, such as Creutzfeldt–Jakob disease, stroke, and head trauma.20
- CSF p-tau and CSF t-tau are robust biomarkers for predicting risk of clinical decline and conversion to dementia in non-demented patients. They may both support AD diagnosis in clinical practice.14
Measure consistent with AD: Increased CSF p-tau and CSF t-tau concentration
FDG PET (18F-fluorodeoxyglucose-positron emission tomography)
The distinct spatial patterns of glucose metabolism in the brain can help physicians to differentiate AD against other forms of dementia and make an accurate and early AD diagnosis.2,18
Reduced FDG PET uptake is a valid indicator of the synaptic dysfunction that accompanies neurodegeneration in AD.11,13
Measure consistent with AD: Brain glucose hypometabolism
Previous stage
Brain Structure
Category: Measure of neurodegeneration: neuronal and synaptic loss accounting for brain atrophy
Structural MRI
Together, abnormal accumulation of amyloid beta plaques and neurofibrillary tangles may cause neurodegeneration through neuronal and synaptic loss leading to brain atrophy.13
Progressive brain atrophy detected by MRI in the hippocampal region is representative of neurodegeneration and is a marker of AD disease progression. The progressive rate of brain atrophy correlates with cognitive decline in AD.21
Measure consistent with AD: Brain volume loss
Previous stage
Cognitive Function
Category: Measure of cognitive impairment
"MCI (mild cognitive impairment) due to AD" is characterized by a confirmed impairment in 1 or more cognitive domains that do not interfere with activities of daily living plus evidence of AD disease pathology.22,23 Typically, deficits in episodic memory and executive function are amongst the first cognitive domains affected in the mild cognitive impairment (MCI) stage of AD.
Accordingly, amyloid beta (Aβ) plaques accumulate initially in the centers of higher mental function and those related to learning and memory. Clinical symptoms are more closely related to neurofibrillary tangles (abnormal phosphorylation of tau protein) than to Aβ plaque formation.24,25
Subjective cognitive decline (SCD) precedes MCI and is made up of a number of symptoms. These can be any or a combination of the following: a subjective complaint of cognitive decline without objective confirmation; a subtle decline measured by longitudinal cognitive testing; or neurobehavioural symptoms.2,26
Screening tests assessing cognitive domains can facilitate recognition of cognitive impairment.27
Measure consistent with AD: Increasing cognitive impairment
Previous stage
Clinical Function
Category: Measure of functional impairment
Ultimately, plaque accumulation compromises areas that regulate attention, emotion, and various other activities, severely impacting daily life.28
This is the final phase in the evolution of AD ranging from mild to moderate and severe AD dementia with progressive impairments in multiple cognitive domains and neurobehavioural changes. Independence is lost and assistance with daily life activities is increasingly required until complete dependency due to severe functional impact.2
Measure consistent with AD: Progessive increase of functional impairment
Previous stage
This understanding of the underlying mechanisms of AD highlights the importance of timely detection and diagnosis as a central component to improve patient care and shorten the patient journey.29

What’s next
Detection of Mild Cognitive Impairment due to Alzheimer’s Disease
Early detection of mild cognitive impairment provides an opportunity to identify Alzheimer’s patients in the pre-dementia stage.
References
1.Masters CL, Bateman R, Blennow K, Rowe CC, Sperling RA, Cummings JL. Alzheimer’s disease. Nat Rev Dis Primers. 2015;1:15056.
2.Jack CR, Bennet DA, Blennow K, et al. NIA-AA Research Framework: Toward a biological definition of Alzheimer’s disease. Alzheimers Dement 2018;14:535–562.
3.Bateman RJ, Xiong C, Benzinger TLS, et al. Clinical and Biomarker Changes in Dominantly Inherited Alzheimer’s Disease. N Engl J Med 2012;367:795–804.
4.Querfurth HW, LaFerla FM. Alzheimer’s disease. N Engl J Med. 2010;362(4):329-344.
5.Selkoe DJ, Hardy J. The amyloid hypothesis of Alzheimer’s disease at 25 years. EMBO Mol Med. 2016;8(6):595-608.
6.Hardy J, Selkoe DJ. The amyloid hypothesis of Alzheimer’s disease: progress and problems on the road to therapeutics. Science. 2002;297(5580):353-356.
7.Onyango IG, Dennis J, Khan SM. Mitochondrial Dysfunction in Alzheimer's Disease and the Rationale for Bioenergetics Based Therapies. Aging Dis. 2016;7(2):201-214. Published 2016 Mar 15.
8.Cheng Y, Tian DY, Wang YJ. Peripheral clearance of brain-derived Aβ in Alzheimer's disease: pathophysiology and therapeutic perspectives. Transl Neurodegener. 2020;9(1):16. Published 2020 May 7.
9.Dubois B, Hampel H, Feldman HH, et al. Preclinical Alzheimer's disease: Definition, natural history, and diagnostic criteria. Alzheimers Dement. 2016;12(3):292-323.
10.Serrano-Pozo A, Frosch MP, Masliah E, Hyman BT. Neuropathological alterations in Alzheimer disease. Cold Spring Harb Perspect Med. 2011;1(1):a006189.
11.Jack CR Jr, Knopman DS, Jagust WJ, et al. Hypothetical model of dynamic biomarkers of the Alzheimer’s pathological cascade. Lancet Neurol. 2010;9(1):119-128.
12.Vinters HV. Emerging concepts in Alzheimer's disease. Annu Rev Pathol. 2015;10:291-319.
13.Sperling RA, Aisen PS, Beckett LA, et al. Toward defining the preclinical stages of Alzheimer’s disease: recommendations from the National Institute on Aging–Alzheimer’s Association workgroups on diagnostic guidelines for Alzheimer’s disease. Alzheimers Dement. 2011;7(3):280-292.
14.Blennow K, Shaw LM, Stomrud E, et al. Predicting clinical decline and conversion to Alzheimer's disease or dementia using novel Elecsys Abeta(1-42), pTau and tTau CSF immunoassays. Sci Rep. 2019;9(1):19024.
15.Lewczuk P, Matzen A, Blennow K, et al. Cerebrospinal Fluid Aβ42/40 Corresponds Better than Aβ42 to Amyloid PET in Alzheimer's Disease. J Alzheimers Dis. 2017;55(2):813-822.
16.Schindler SE, Gray JD, Gordon BA, et al. Cerebrospinal fluid biomarkers measured by Elecsys assays compared to amyloid imaging. Alzheimers Dement. 2018;14(11):1460-1469.
17.Willemse EAJ, Tijms BM, van Berckel BNM, et al. Comparing CSF amyloid-beta biomarker ratios for two automated immunoassays, Elecsys and Lumipulse, with amyloid PET status. Alzheimers Dement (Amst). 2021;13(1):e12182. Published 2021 May 1.
18.Suppiah S, Didier MA, Vinjamuri S. The Who, When, Why, and How of PET Amyloid Imaging in Management of Alzheimer's Disease-Review of Literature and Interesting Images. Diagnostics (Basel). 2019;9(2):65. Published 2019 Jun 25.
19.Blom ES, Giedraitis V, Zetterberg H, et al. Rapid progression from mild cognitive impairment to Alzheimer's disease in subjects with elevated levels of tau in cerebrospinal fluid and the APOE epsilon4/epsilon4 genotype. Dement Geriatr Cogn Disord. 2009;27(5):458-464.
20.Riemenschneider M, Wagenpfeil S, Vanderstichele H, et al. Phospho-tau/total tau ratio in cerebrospinal fluid discriminates Creutzfeldt-Jakob disease from other dementias. Mol Psychiatry. 2003;8(3):343-347.
21.Fox NC, Scahill RI, Crum WR, Rossor MN. Correlation between rates of brain atrophy and cognitive decline in AD. Neurology. 1999;52(8):1687-1689.
22.Morris JC, Blennow K, Froelich L, et al. Harmonized diagnostic criteria for Alzheimer’s disease: recommendations. J Intern Med. 2014;275(3):204-213.
23.Winblad B, Palmer K, Kivipelto M, et al. Mild cognitive impairment--beyond controversies, towards a consensus: report of the International Working Group on Mild Cognitive Impairment. J Intern Med. 2004;256(3):240-246.
24.Bennett DA, Schneider JA, Wilson RS, Bienias JL, Arnold SE. Neurofibrillary tangles mediate the association of amyloid load with clinical Alzheimer disease and level of cognitive function. Arch Neurol. 2004;61(3):378-384.
25.Svenningsson AL, Stomrud E, Insel PS, Mattsson N, Palmqvist S, Hansson O. β-amyloid pathology and hippocampal atrophy are independently associated with memory function in cognitively healthy elderly. Sci Rep. 2019;9(1):11180. Published 2019 Aug 1.
26.Jessen F, Amariglio RE, Buckley RF, et al. The characterisation of subjective cognitive decline. Lancet Neurol. 2020;19(3):271-278.
27.Krolak-Salmon P, Maillet A, Vanacore N, et al. Toward a Sequential Strategy for Diagnosing Neurocognitive Disorders: A Consensus from the "Act On Dementia" European Joint Action. J Alzheimers Dis. 2019;72(2):363-372.
28.Serrano-Pozo A, Frosch MP, Masliah E, Hyman BT. Neuropathological alterations in Alzheimer disease. Cold Spring Harb Perspect Med. 2011;1(1):a006189.
29.Petersen RC. Mild cognitive impairment. Continuum (Minneap Minn). 2016;22(2):404-418.